From one flat Odoo export to a POS dashboard that catches cash errors
A hierarchical Odoo POS export, nearly 30,000 rows deep, rebuilt into a four-table star schema and two dashboards. Including the measure that catches a cashier whose errors cancel out.
Note on the data. Everything shown here runs on a synthetic dataset I generated myself. The fictional cafe chain, the outlets, the staff names, and every number are invented. The structure of the export is faithfully modelled on a real Odoo POS file, because that structure is the whole point of the project. No client data appears anywhere in this post.
A contact running a retail business on Odoo asked me a simple question. He had exported his POS data, opened it in Power BI, and could not get the numbers to make sense. Could I help him find the “odds” in it, the returns, the payment patterns, the cashier mistakes he suspected but could not see.
The finished build turns a single 29,630 row export into a four table star schema, 13,536 invoices, and two dashboards. The second one does something a normal sales report cannot: it identifies a cashier whose till errors are large and consistent, but whose net variance is close to zero, so a standard report would never flag her.
The problem
Odoo does not export POS data as a clean table of sales. It exports a session, and everything underneath it, flattened into one sheet.
So a single file holds three different levels of data stacked on top of each other. At the top sits the session: the outlet, who opened it, when it closed, the cash counted at the end. Below that sits each order, with its total and its payment. Below that sit the individual product lines that make up the order.
The trap is that values only appear on the first row of each block. An order’s total sits on its top line, and the product rows underneath it are blank in that column. Those blanks are not missing data. They are the export’s way of showing hierarchy.
Load that straight into Power BI and sum the order total, and the answer is wrong. The total sits on one row, but the order spans several. This is exactly where my contact got stuck, and it is where most first attempts at an Odoo export get stuck.
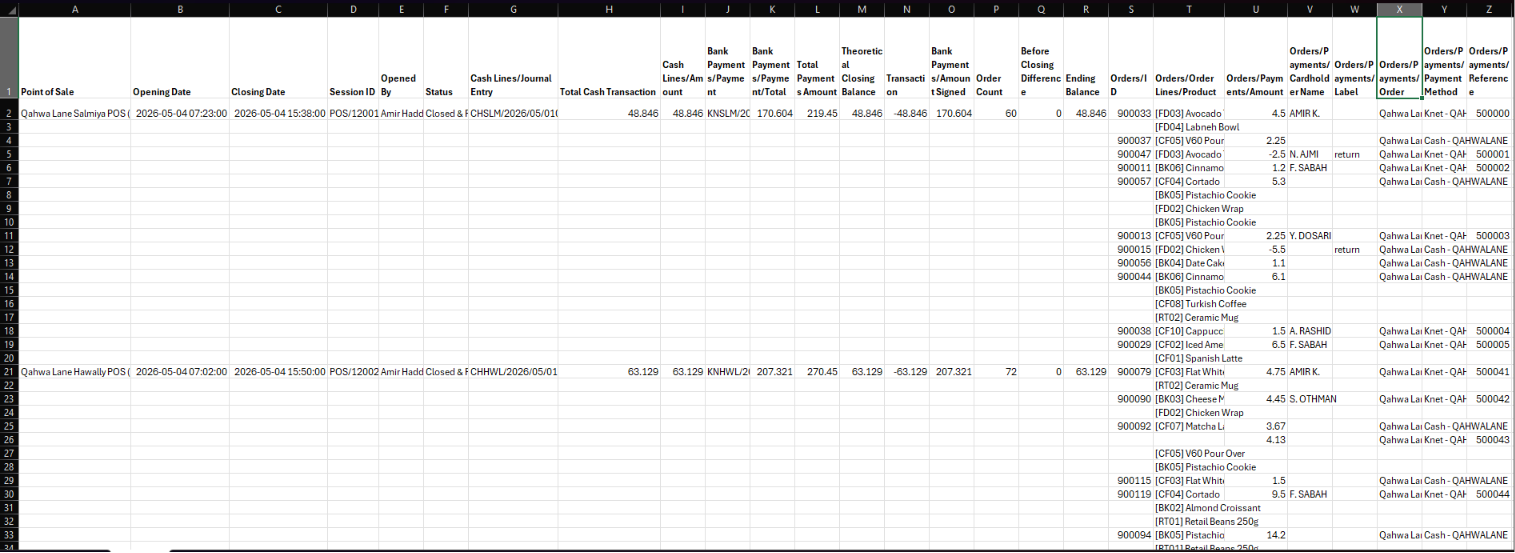
Look at the left side of that export. The session columns and the cash figures appear once, on the opening row, then go blank. The order IDs appear, then go blank. The product names run down the sheet on their own. Every blank cell is a value that belongs to the row above it.
How I built it
The first thing I did was not open Power BI. I sat with the file and counted.
One session. 163 orders in the sample he sent, which matched the file’s own Order Count field, so I knew I had the grain right. 183 payment rows, which was more than the order count, and that told me some orders were paid two ways, part card and part cash. 20 returns, tagged with a label and a negative amount.
Those four numbers became my validation checks for everything that followed. If my cleaned tables did not reproduce them, I had broken something.
Splitting one sheet into four tables
The cleaning problem is a trap with two jaws. If I fill the blanks down, every product row inherits the order total and the money multiplies. If I do not fill them down, the product rows and the split payment rows have no order to attach to.
The way out is to fill down only the keys, and only onto copies of them.
I duplicated the Order ID and Session ID into two new columns, filled those down, and left the original ID columns untouched. Now every row knows which order and session it belongs to, but the original columns are still blank exactly where they were blank, which means I can still tell a header row from a detail row.
After that, each table is just a filtered view of the same cleaned source.
DimSession is the rows where the original Session ID was filled. FactOrders is the rows where the original Order ID was filled. FactPayments is the rows carrying a payment amount. FactOrderLines is the rows carrying a product.
The payment count is the detail I care about most. It comes out higher than the order count, because split payments survive the split. An order paid partly in cash and partly by card stays as two payment rows, so the payment mix stays honest.
Money then gets summed from the table that owns it. Revenue from the order grain. Payment mix from the payment grain. Quantities from the line grain. Never across.
The turning point
The sales page was straightforward once the model was right. The second requirement was the interesting one.
He wanted to know which cashiers were making mistakes. Taking cash and recording it as card. Miscounting the till. His instinct was to look at each cashier’s cash variance, the gap between the cash counted at close and the cash the system expected.
That instinct is right, but the obvious measure is wrong.
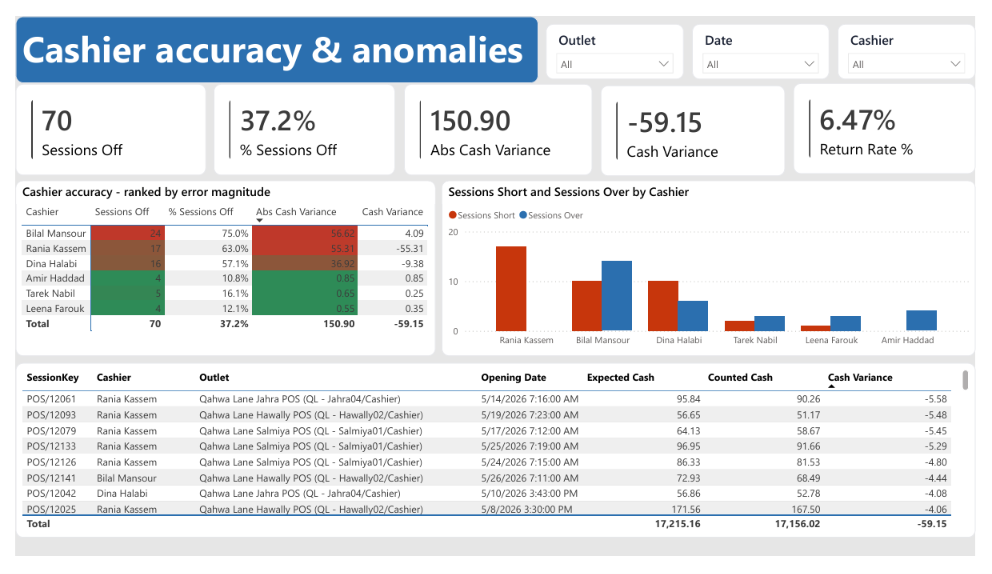
If you sum a cashier’s variance, a shortage on one shift cancels an overage on another. A cashier who is careless in both directions lands near zero and looks clean. So I built the ranking on absolute variance, the total size of the errors regardless of direction, alongside a count of how often the till fails to reconcile. Net variance stays in the report, but it does a different job: it tells you the direction of the problem, not the size of it.
That distinction is the entire value of the page. Look at the top two cashiers in the result:
| Cashier | Sessions off | Absolute variance | Net variance |
|---|---|---|---|
| Bilal Mansour | 24 (75%) | 56.62 | +4.09 |
| Rania Kassem | 17 (63%) | 55.31 | -55.31 |
Almost identical error magnitude. Completely different problems. Bilal is careless in both directions and nets out near zero. Rania is short nearly every single time she is off. A net variance report would put Bilal at the top of the list and leave Rania invisible.
The result
Two pages, because two questions.
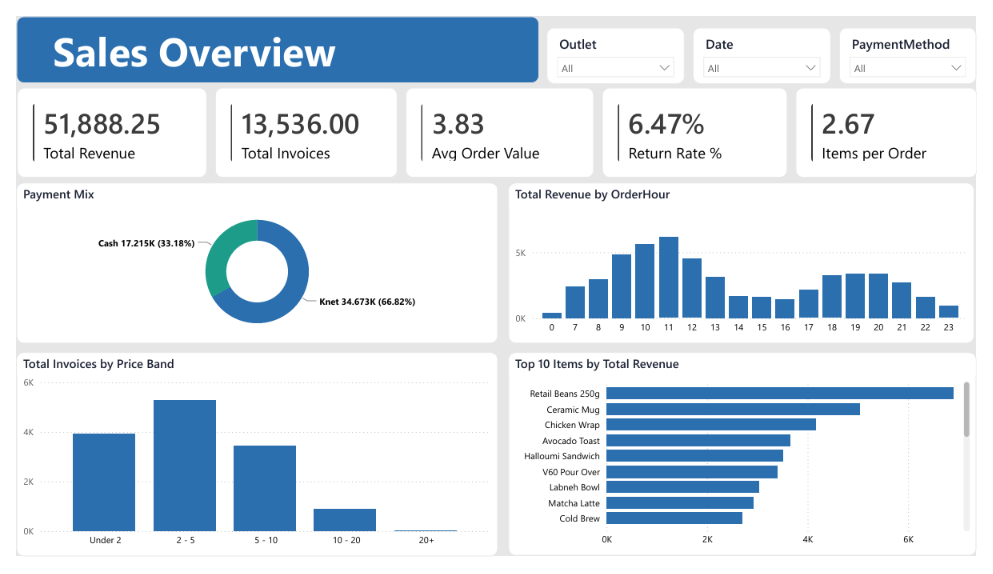
Sales Overview answers “how is the business doing”. Revenue, invoice count, average order value, the payment mix between card and cash, trading by hour, top products, and an invoice count split into price bands. This is the page most people expect, and in a market where a lot of businesses are still running on exported spreadsheets, it is often the first time someone sees their own trading day laid out clearly.
Cashier accuracy answers “where are the mistakes”. Ranked accuracy by cashier, a short versus over breakdown that separates the careless from the consistently short, and a session level drill down showing expected cash against counted cash.
One thing I did not build. He also asked for failed network transactions, and that field simply does not exist in the export. I said so rather than approximating it. Half the value of an analyst is being clear about what the data cannot answer.
What I would tell another analyst
Count before you build.
The whole project turned on one hour spent with the raw file before I opened Power BI, counting sessions, orders and payments by hand. Those numbers became the tests that told me my cleaned tables were correct. Without them I would have had four tables that looked plausible and no way to know if they were right.
The second lesson is about measure design. The obvious aggregation is often the wrong one. Summing a variance destroys the very thing you are trying to see, because errors in opposite directions cancel. Before you write a measure, ask what the sum is hiding.
And when the data cannot answer the question, say so early. That answer is worth more than a chart built on an assumption.
← Back to Projects