HealthReach International: a dual-audience healthcare dashboard in Power BI
A portfolio Power BI project on fully synthetic data. One model that answers both clinical and donor questions across a 31-country humanitarian health program.
A note on the data. HealthReach International is a fictional humanitarian health NGO I created for this portfolio project. Every figure here is synthetic, generated by a Python script, with no real patient, donor, or organization data. The name refers to no real entity. The point of the project is the dashboard design, the data model, and the DAX, not the numbers themselves.
Why I built this
I’ve worked in retail analytics for twelve years. Almost all of that work is confidential, so I could never show it. In interviews, when someone asked to see my dashboards, I had nothing to share.
So I built a project I could show.
I picked healthcare for two reasons. After twelve years I wanted to work outside retail for once. And a short consulting stint at a Ministry of Health had shown me how health data looks and behaves. So I made up an NGO, generated data for it, and built a full report.
Two audiences, one dataset
A humanitarian health program has two very different audiences.
Clinical staff want to know what is happening to patients: which diseases are rising, which facilities are busy, whether treatments work. Donors want to know where their money went: what it delivered, and what each outcome cost.
Most dashboard demos serve only one side. I wanted one model that could answer both, across 31 countries in Sub-Saharan Africa and Yemen.
The data
The data is fully synthetic. I generated it with a Python script (pandas and numpy) using a fixed seed so it is repeatable. No real patient data was used.
I did not want random numbers. Random data looks fine and means nothing. So I built real patterns into about 500,000 rows:
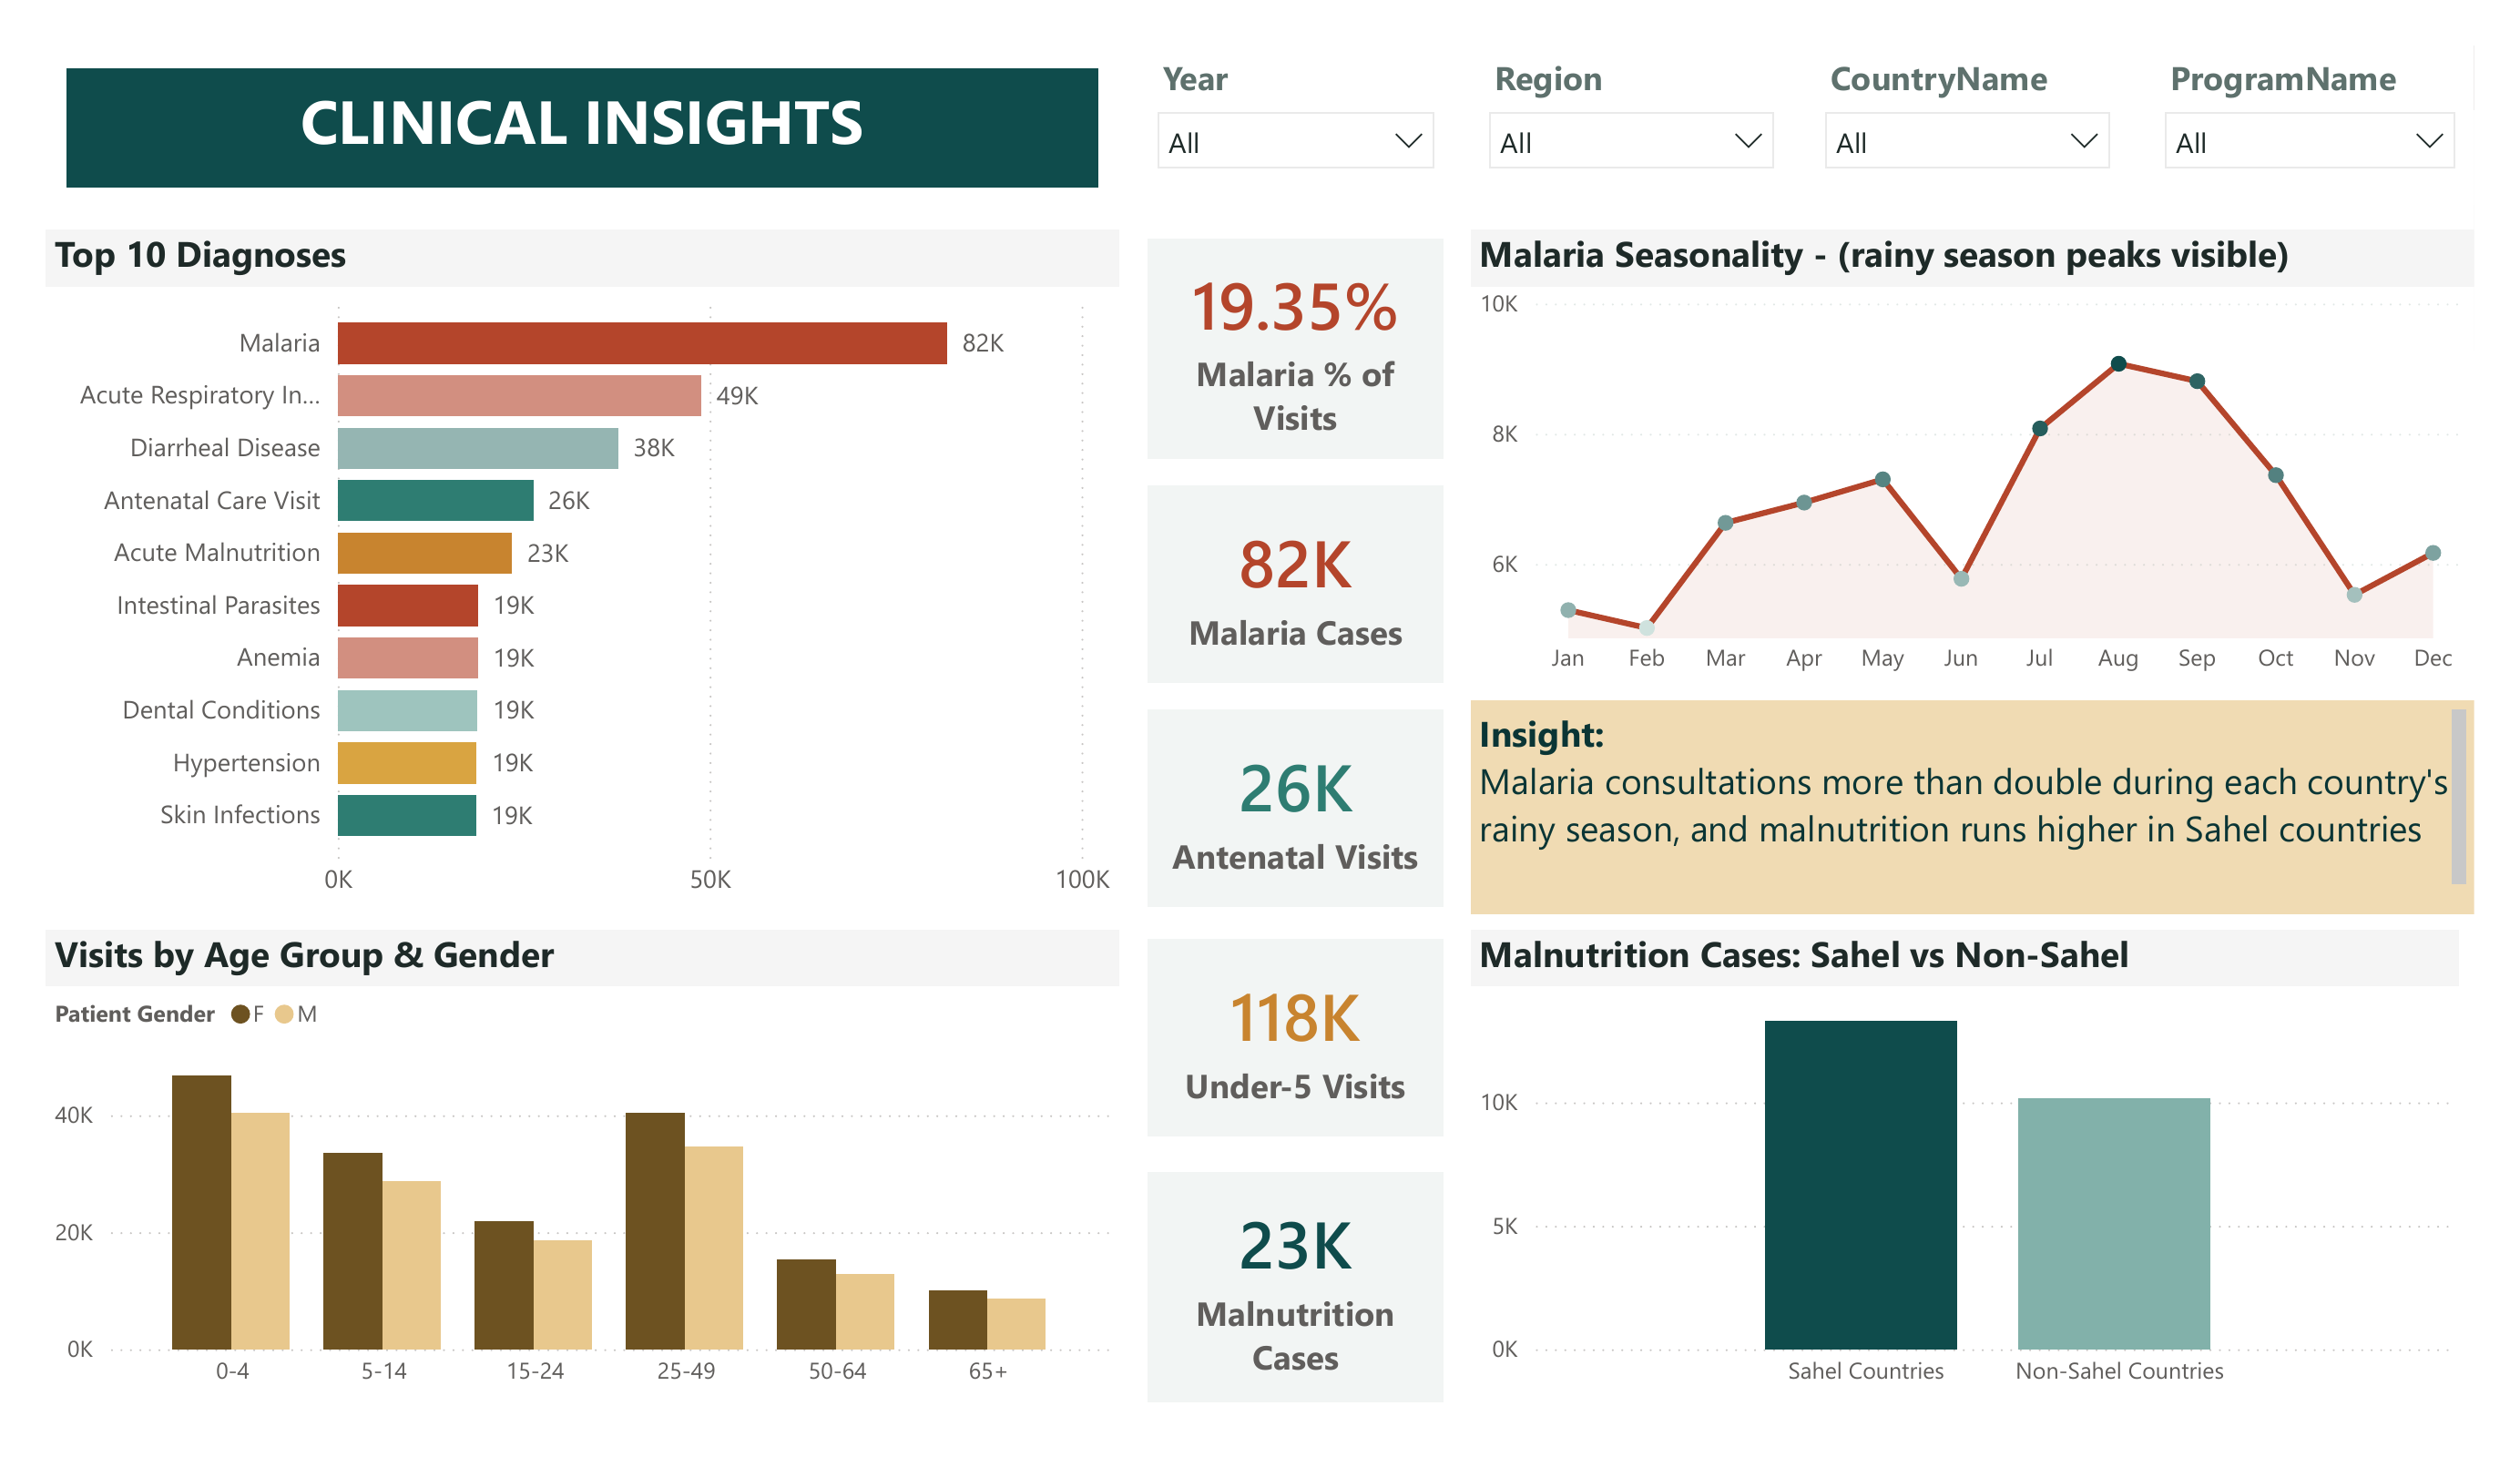
- Malaria more than doubles in each country’s rainy season
- Malnutrition runs about 2.7 times higher in Sahel countries
- Eye conditions make up around 45% of camp visits
- Donations spike in seasonal giving periods
- Antimalarial stockouts get worse when malaria peaks
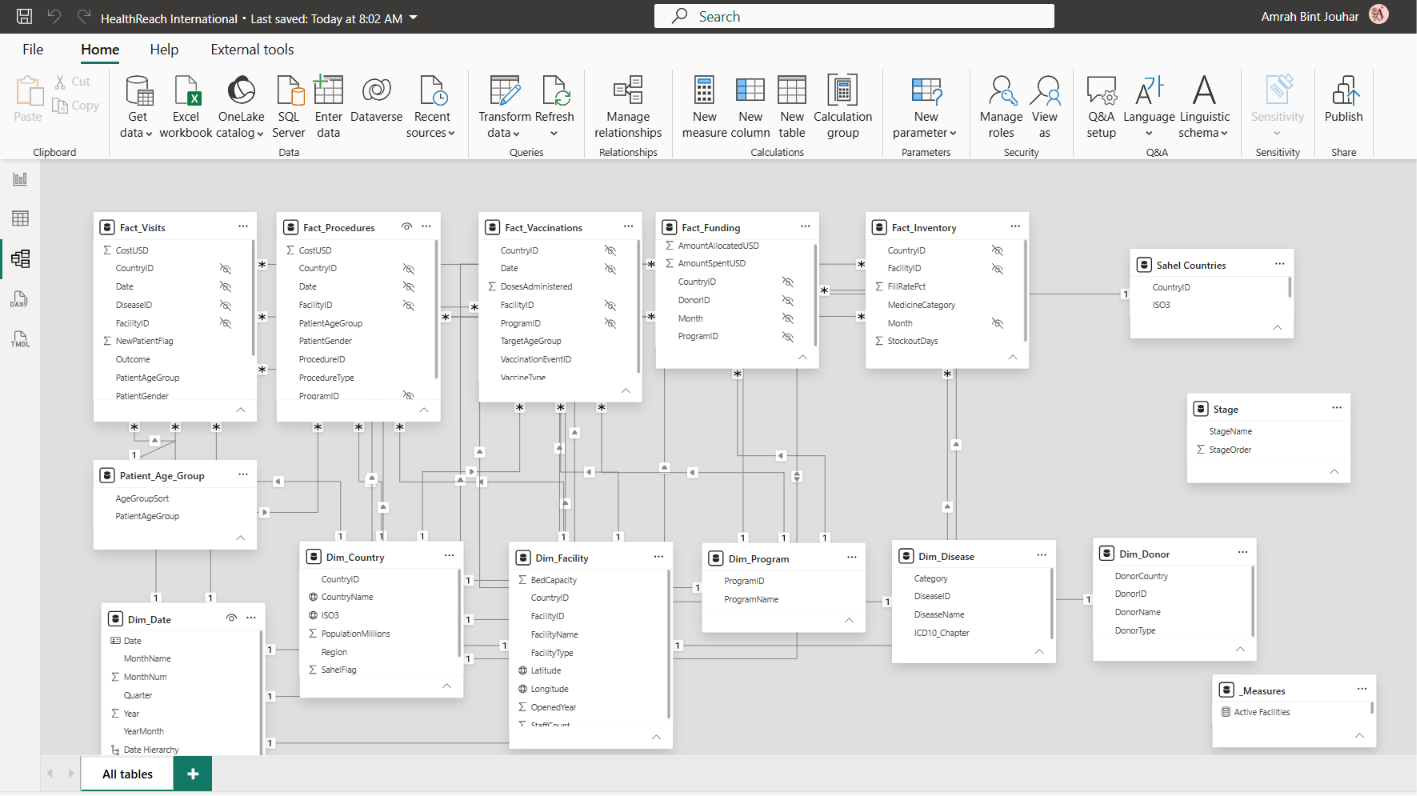
The structure is a galaxy schema: 6 dimension tables (Country, Facility, Program, Disease, Date, Donor) and 5 fact tables (Visits, Procedures, Vaccinations, Funding, Inventory). The CSVs were clean, so Power Query stayed light: set data types, keep IDs as text, check the dates.
Three views of the same program
One report, three pages, each aimed at a different reader.
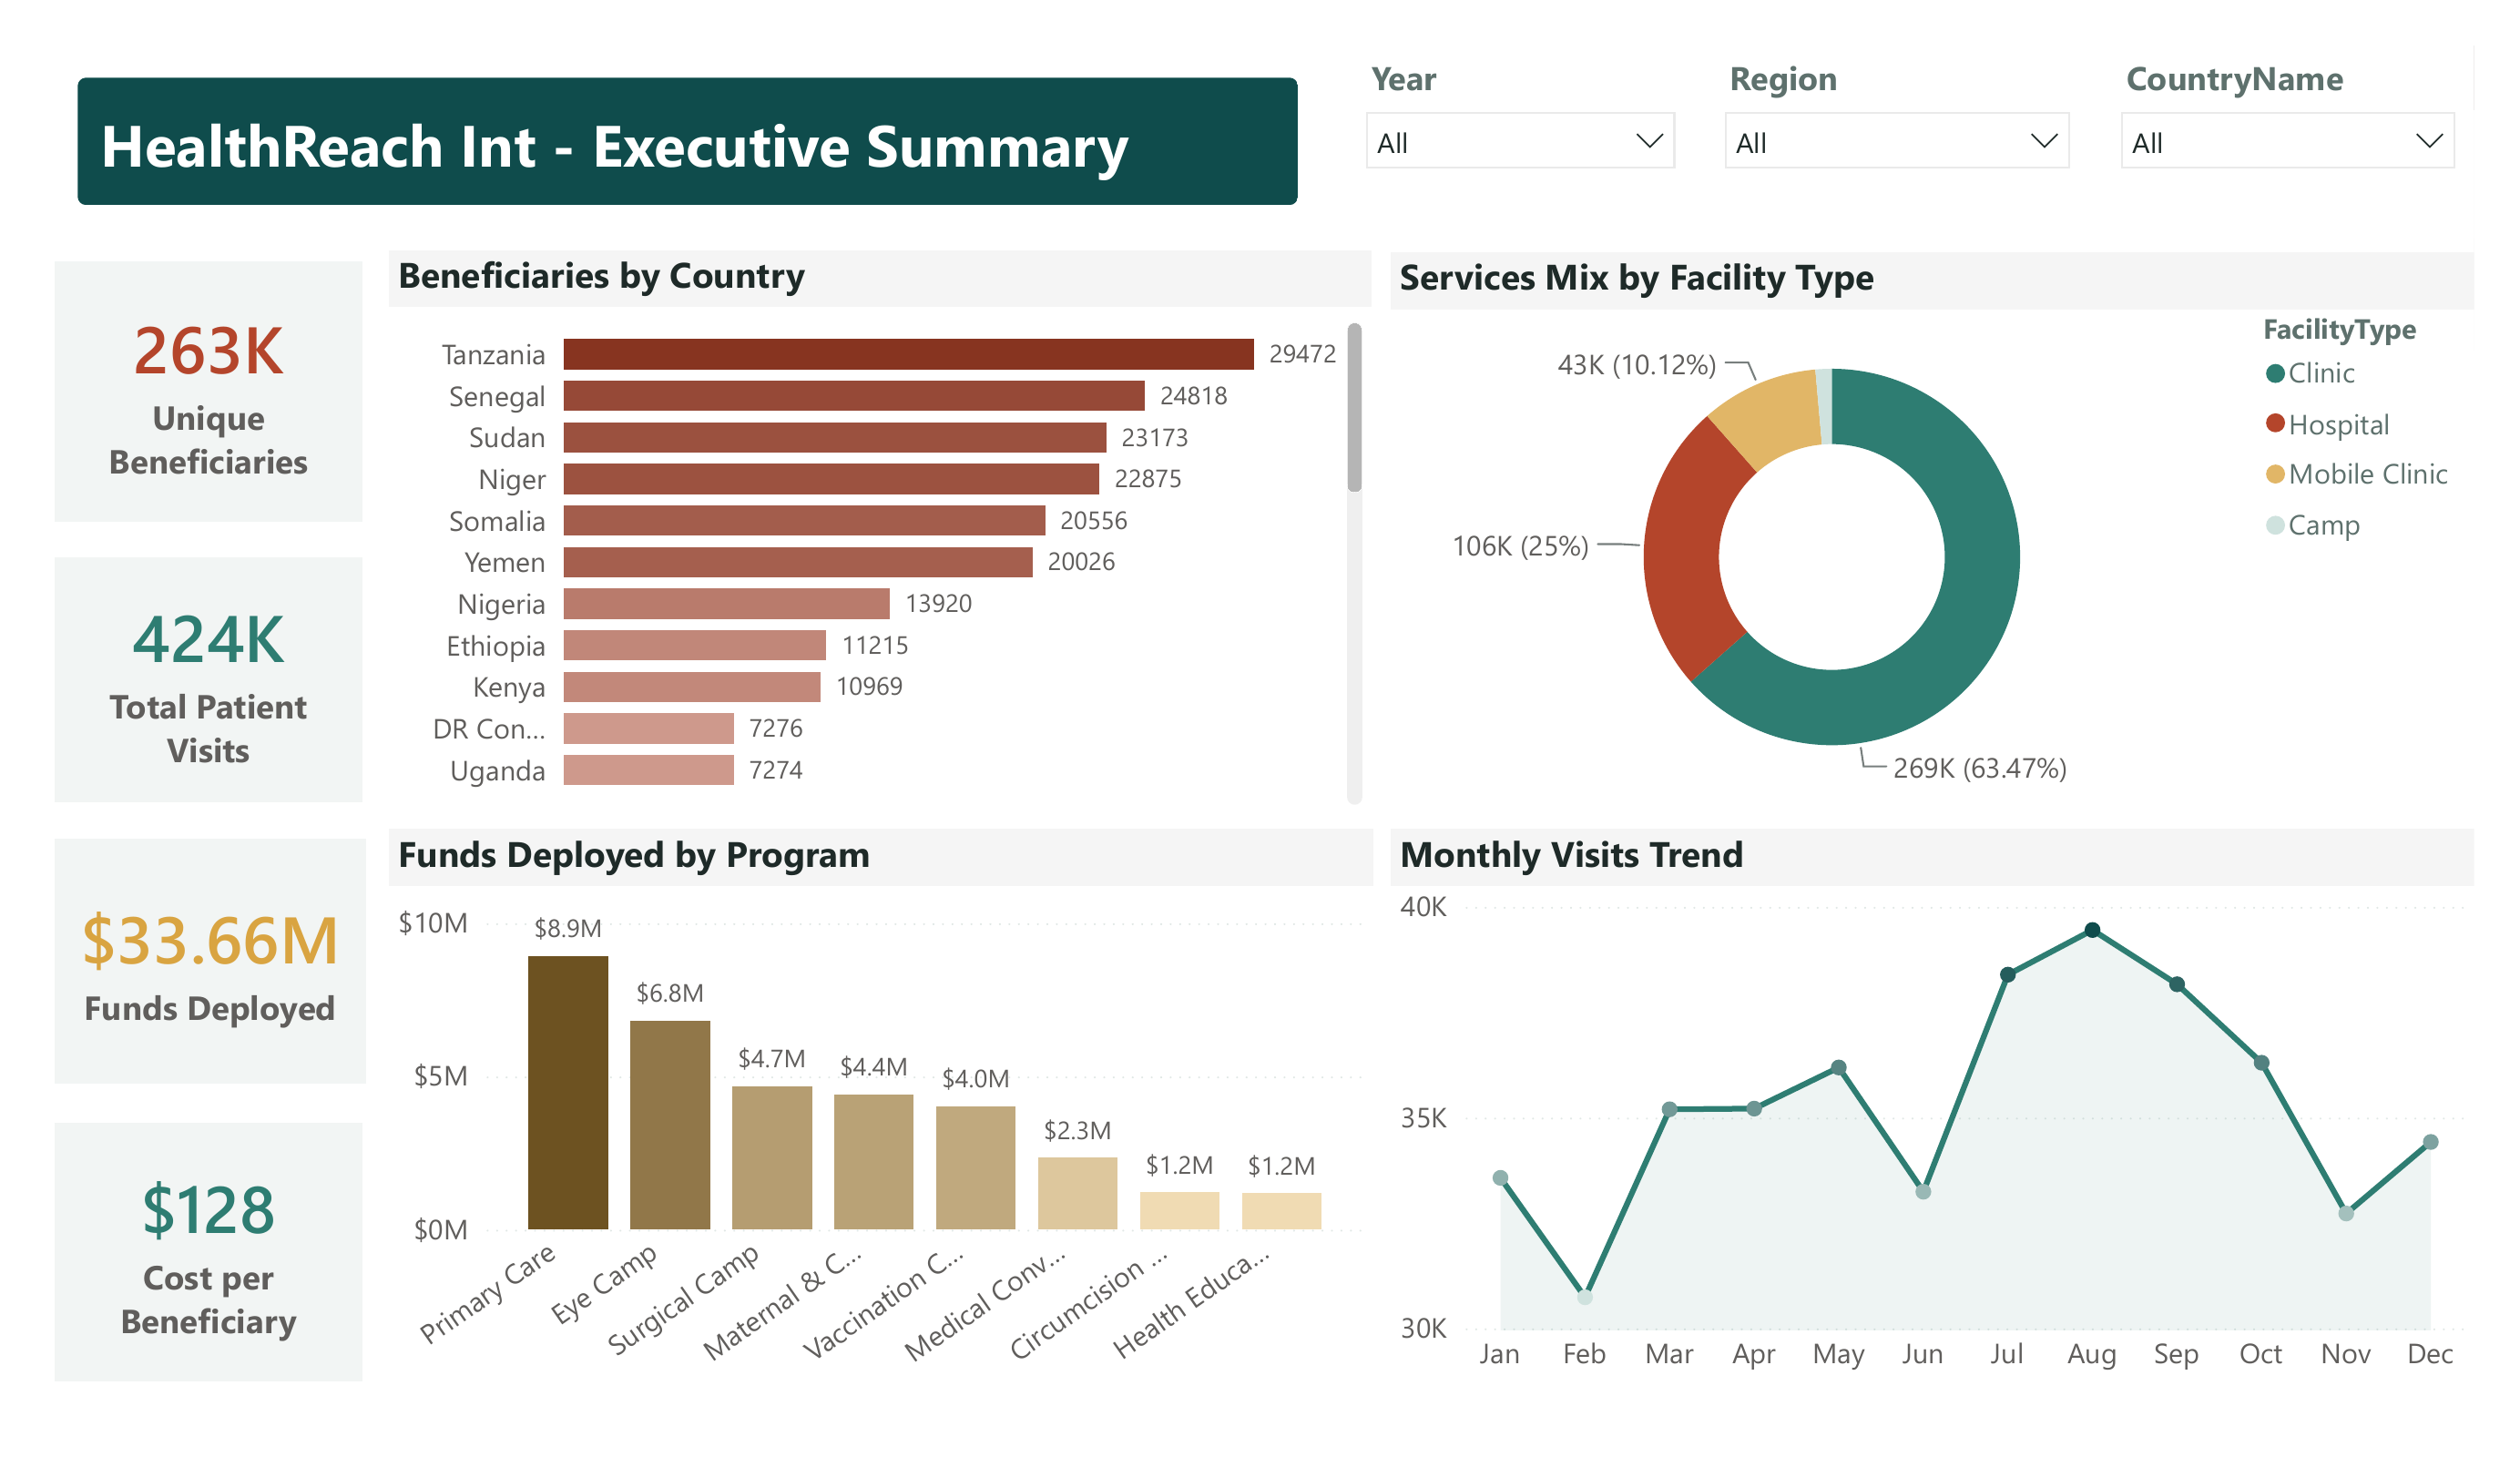
Executive Overview
Headline KPIs, beneficiaries by country, funds by program, the monthly visit trend, and the mix of services by facility type. The page a director opens first.
Clinical Insights
Malaria, malnutrition, under-5 and antenatal KPIs, the top 10 diagnoses, malaria seasonality, visits by age and gender, and Sahel vs non-Sahel malnutrition. This is where the built-in patterns show up. The rainy-season malaria wave is right there in the line.
Donor Impact
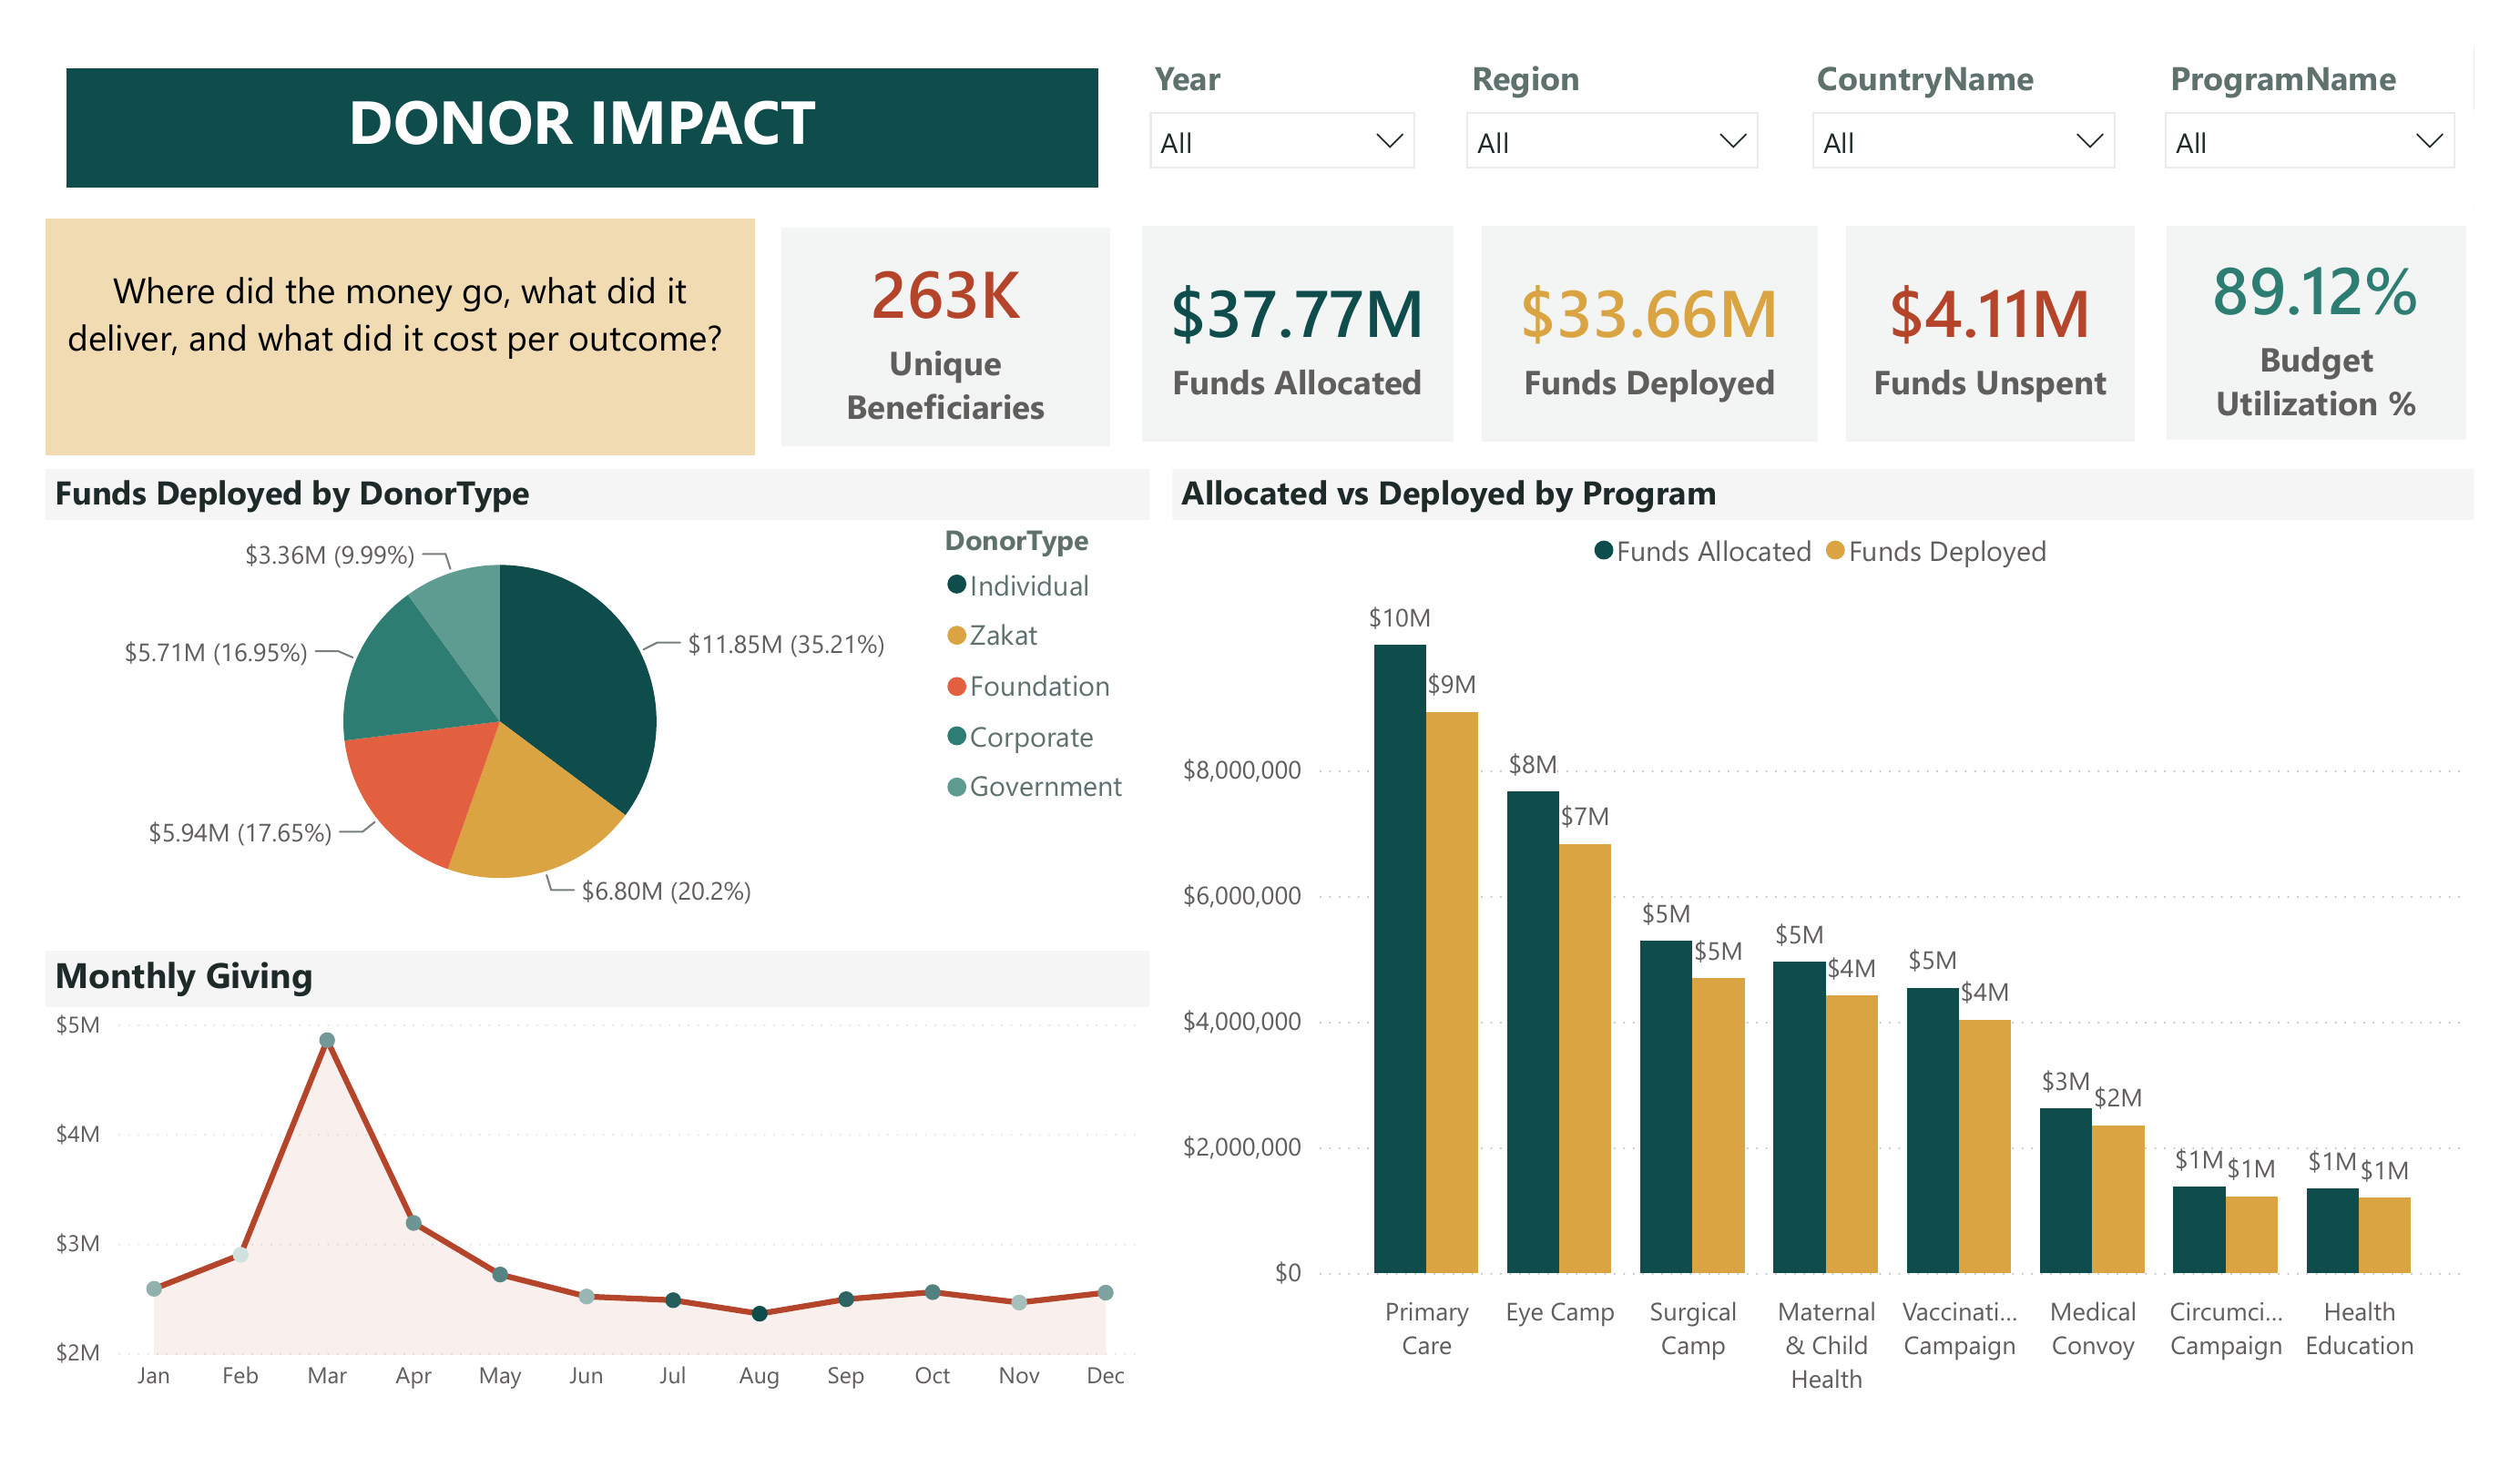
Funds allocated, deployed and unspent, budget utilization, the donor-type breakdown, monthly giving, and allocated vs deployed by program. The same program, asked a different way: what did it cost, and what did it deliver?
The data model
Under the hood is a clean star schema. Country and Facility both connect straight to the facts as conformed dimensions. I deliberately did not link them to each other, to avoid ambiguous filter paths.
On top of the model sit about 45 DAX measures across visits, clinical rates, funding, and cost per outcome. A few of the main ones:
Unique Beneficiaries =
CALCULATE ( COUNTROWS ( Fact_Visits ), Fact_Visits[NewPatientFlag] = 1 )

Budget Utilization % = DIVIDE ( [Funds Deployed], [Funds Allocated] )

Cost per Beneficiary = DIVIDE ( [Funds Deployed], [Unique Beneficiaries] )

Malnutrition Share % = DIVIDE ( [Malnutrition Cases], [Total Visits] )
To avoid formatting every visual by hand, I pushed the styling into a custom theme JSON, so the whole report used one look by default.
When the numbers settle, the synthetic program reports 263K beneficiaries, 424K visits, about 33.6K procedures (including 11.6K cataract surgeries at a 96.6% success rate), 627K vaccine doses, and $37.8M allocated at 89.1% utilization, for a cost of $128 per beneficiary. That covers 31 countries and 120 facilities from 2023 to 2025.
Where the build fought back
The parts I learned from were the visuals that did not work.
The funnel. I tried a funnel from funds to outcomes. It looked terrible. Money ($37.8M) and people (424K) sit on totally different scales, so the patient bars almost vanished. A funnel only works when every stage uses the same unit. I switched to labelled bars.
The chart that argued with its caption. My caption said malnutrition runs 2.7 times higher in the Sahel. The bar chart under it showed the opposite, because there are more non-Sahel countries, so raw counts hide the rate. I switched to a share % measure, and the chart finally matched the words.
The ages that sorted wrong. My age bands lined up as 0-4, 25-49, 5-14. Power BI was sorting them as text. A numeric sort column fixed it. Sort order is a choice, not a default.
What I took from it
One idea connects all three fixes, and it is the thing I care about most: a chart has to earn what it says. Not look convincing. Be honest. The funnel looked fine and lied about scale. The malnutrition chart looked fine and lied about the trend.
That is also why the disclaimer sits at the top. The data is invented, and saying so plainly is part of the same honesty. The model, the measures, and the design are real work.
After twelve years of dashboards I could never show, this is the first one I can share in full.
← Back to Projects